The low-dimensional representation of high-dimensional data makes t-SNE an attractive visualisation tool, yet it also has value as an analytical tool. We have developed the Cross Entropy test, a statistical test capable of distinguishing biological differences in single cell t-SNE representations, while being robust against false detection of differences in technical replicates or the seed-dependent variation in t-SNE generation. As the t-SNE algorithm is driven by the cross entropy of the individual cells in the dataset, and the t-SNE fixes the average point entropy, each t-SNE can be considered a distribution of cross entropy divergences. Deriving a distribution of cross entropy divergences per t-SNE plot therefore allows the use of the Kolmogorov-Smirnov test to evaluate the degree of difference between two, or more, t-SNE plots.
The Cross Entropy test is a useful tool for calculating p values on the difference between any two t-SNE or UMAP plots, whether the data comes from flow cytometry, mass cytometry or single cell sequencing. Further, the test generates a quantitative comparison of the extent of differences, allowing you to compare multiple t-SNE or UMAP plots and identify outgroups and clustered samples. See an overview of the Cross Entropy test given by Dr Oliver Burton:
t-Distributed Stochastic Neighbor Embedding (t-SNE) is the most commonly used non-linear dimensionality reduction algorithm for single cell biology. In its common usage for visualising high-dimensionality single cell data, the algorithm starts with the single cells distributed at random points, along a Gaussian distribution, in transformed space. In an iterative process the cells move along a cost gradient, which provides a penalty for mismatch between the distances between two cells in the original high-dimensional space versus the representational low-dimensional space. In its common usage for visualising high-dimensionality single cell data, the cost gradient of t-SNE places greater weight on pairs of cells close to each other, with medium- and long-range pairs ignored. When sufficient iterations have occurred to reach stability, the outcome produces clusters of similar cells, based on the input data. Membership of a cluster indicates shared properties, however the non-linear nature of the penalty cost does not allow relationships to be inferred by the relative positioning of the clusters.
Running the same dataset through a t-SNE multiple times results in a visually distinct stable states, owing to the random placement of the input data at the first stage. The high cost of violation of local distances ensures that local clusters are maintained across runs, while the low cost of medium- and long-range pairs permits multiple stable states with rotational symmetry to develop. An under-appreciated aspect of the t-SNE algorithm is the early exaggeration of the penalty for violating local distances for the first 50 iterations. Visualising t-SNE runs at each iteration demonstrates that the early exaggeration phase involves a sharp contraction of all points, which then expand out into separate clusters when the exaggeration factor is removed. This early exaggeration is integral to the t-SNE calculation, as maintaining the high penalty throughout results in dense overlapping clusters, while maintaining the low penalty throughout permits splitting of clusters, as cells close together in high-dimensional space do not come in close enough proximity in representational space to drive clustering. It is important to allow both phases and sufficient iterations for the t-SNE to reach stability for consistency in results.
Iteration-by-iteration visualisation of the t-SNE for two unique seeds of the same dataset. Note the initial collapse of the sample into very small distances, and the rotational symmetry observed between the two runs as the samples slowly expand with extra iterations.
Iteration-by-iteration visualisation of the t-SNE for two unique seeds of the same dataset, with no initial exaggeration of the penalty. As the initial collapse of the sample is reduced, similar cells can avoid coming into close enough contact to drive cluster formation. As a result, biological clusters are split in the final representation and repeat runs vary greatly.
A new algorithm developed by researchers at the Babraham Institute provides a fast and effective way to reduce errors in flow cytometry data analysis, overcoming a major restriction on harnessing the full potential of the power of flow cytometry in cell analysis.
The tool, called AutoSpill, addresses the problem of overlapping signals and autofluoresence, which can be misinterpreted as genuine results.
Researchers can use the tool, available online and through the software package FlowJo, to easily reduce compensation errors in their flow cytometry data.
Flow cytometry is a key investigative tool used in biomedical research, allowing researchers to identify, separate and study cells according to their characteristics, often working with cell samples containing millions of cells at an analysis pace of a million cells per minute. Cell identification is achieved by labelling cells with fluorescent tags. As with personal gadgets and devices, innovation in molecular biology technologies isn’t standing still. Advances in flow cytometry have allowed scientists to gather data on a growing number of parameters, simultaneously detecting over 30 different tags at a time to allow more sophisticated analyses and much deeper levels of insight. However, while flow cytometry equipment has been updated, the accompanying computational requirements have received less attention, until now. AutoSpill, an algorithm developed by researchers at the Babraham Institute and the VIB Center for Brain Research, brings data processing in line with state-of-the-art machines, simplifying data analysis and increasing accuracy. The new technique is published in Nature Communicationstoday.
Immunology programme senior group leader Prof. Adrian Liston, explained: "Flow cytometry is a foundational technology across many different biomedical research areas, and is a key diagnostic tool in immunology, haematology and oncology. Despite the technical progress over the past decades, the technology has been held back by the mathematical processing of the data. Our new approach reduces error by 100,000-fold, making research and diagnostics more accurate. The collaboration with FlowJo has enabled us to instantly reach 80,000 users. It is very gratifying to see computational biology have a direct and real impact on research and diagnostics."
Using multiple fluorescent signals raises a key issue in flow cytometry called spillover. Spillover occurs because each tag, called a fluorophore, emits light within a range of wavelengths, giving it a unique colour. When multiple fluorophores are used, the signals begin to overlap. To accurately distinguish between two distinct fluorophore signals, researchers must process their data to compensate. Because flow cytometry uses so many different colour tags on each cell, the spillover between colours quickly accumulates, limiting scientists’ power to draw reliable conclusions from their results. The processing of data to remove the spillover between the different colours, known as compensation, is necessary for all flow cytometry experiments. Current methods require many hours of manual work, but AutoSpill reduces the process to minutes.
Dr Rachael Walker, Head of the Institute Flow Cytometry facility, commented: “The new AutoSpill Fluorescence Compensation algorithm is a great tool for quick, simple and accurate compensation. It allows compensation to be accurately calculated on samples where the traditional algorithm is difficult to use. AutoSpill’s integration into the FlowJo post-acquisition software highlights the importance of this new compensation method.”
Another limitation of flow cytometry is autofluoresence, fluorescence produced naturally by cells. The removal of these artefacts by AutoSpill is particularly useful for cancer biologists as tumour cells are high in autofluorescence, which can confuse identification of the type of tumour cell present. By solving these sources of error, AutoSpill can help remove false positives from cell analyses, ensuring more accurate data interpretations.
AutoSpill is available through open source code and a freely-available web service. AutoSpill, and a complementary related tool, AutoSpread, are also available in FlowJo v.10.7. Dr John Quinn, Director of Science and Product Development, FlowJo added: “AutoSpill & AutoSpread have been a revelation for FlowJo users. Compensation has long been one of the most perplexing aspects of cytometry, with the most critical requirement being pristine compensation controls collected for each and every parameter in an experiment. Overall, the combination of these two tools makes compensation both easier and more robust. As an indicator of the popularity of this new approach, the webinar held in conjunction with Nature to introduce AutoSpill / AutoSpread in FlowJo has been viewed over 400 times after the initial live event. We at FlowJo believe the AutoSpill / AutoSpread approach will be the primary means of approaching compensation moving forward.”
I am really thrilled to release AutoSpill onto BioRxiv. AutoSpill is a novel method for applying compensation to flow cytometry data, which reduces the error by ~100,000-fold. It is thanks to AutoSpill that we can push machines to their max colours, and actually get good quality 40+ parameter flow cytometry data. AutoSpill is a beautiful example of what maths can add to #immunology, led by the talented Dr Carlos Roca.
So how does AutoSpill work? If you just want to compensate your data, simply upload your single colour controls to https://autospill.vib.be and then copy the spillover matrix to your flow cytometry program of choice. Dr Carly Whyte made this easy two minute tutorial:
If you program your flow cytometry analysis in R, we have also released the AutoSpill full code, so you can add this to your bioinformatics pipeline.
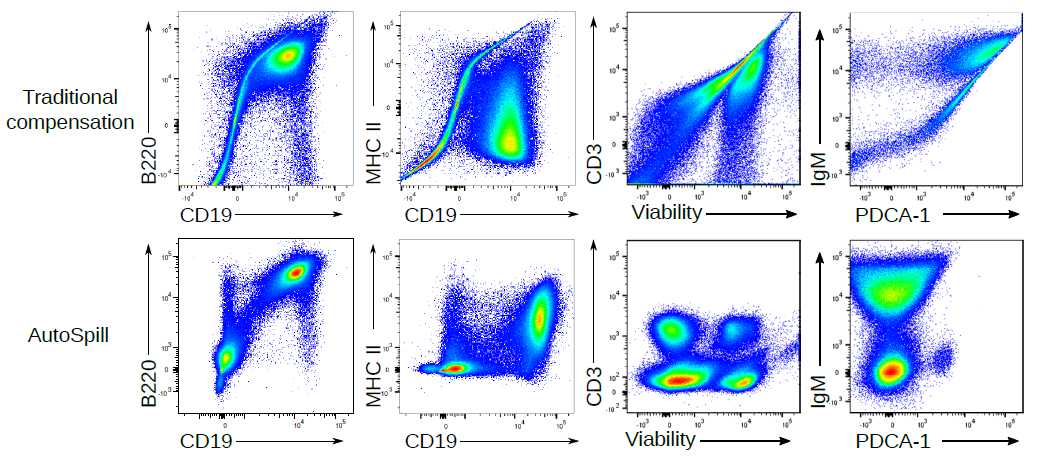
Here are a few examples of the error reduction you can get with AutoSpill:
In high dimensional flow cytometry traditional compensation errors create artefacts. AutoSpill creates a perfect spillover matrix. What does a "perfect" spillover matrix mean? An error reduction of 100,000-fold on average, to the point where error is practically zero. (if you are using the script, you can reduce the error further - we stop the improvement at this point because it is functionally perfect). This means the large over/under-compensation effects can be completely removed from your data. If you want to run 28 colour flow cytometry on a 28 colour machine, you can spend hours-upon-hours compensating your data by hand, or 2 minutes with AutoSpill. AutoSpill is designed to run through the same operations that a skilled flow user does, just faster. But always remember - the compensation can still only be as good as the quality of the single colour controls!
How does AutoSpill work? It is a huge surprise to me, but with the enormous effort over decades to add extra lasers and new flurophores onto machines, the mathematics behind compensation hasn't been updated since 1993, where it was designed for 3 colour flow on computers with 100,000-fold less capacity. For decades we've been building more-and-more expensive machines, and haven't updated the basic maths that the machines run on!
Traditional compensation defines a positive and a negative population, finds the slope and uses that as the spillover matrix. It still works okay in most cases, it is just that the small errors start piling up when you are making 250+ calculations on a high parameter dataset.
AutoSpill is actually fairly simple at heart:
Draw an automatic live cell gate
Use linear regression to take into account every cell, not just the two data points of average positive and average negative
Calculate the error left, using the sum of errors in every compensation pair
Use the residual error and return to step 2
Repeat the tweaking of the matrix until error is gone
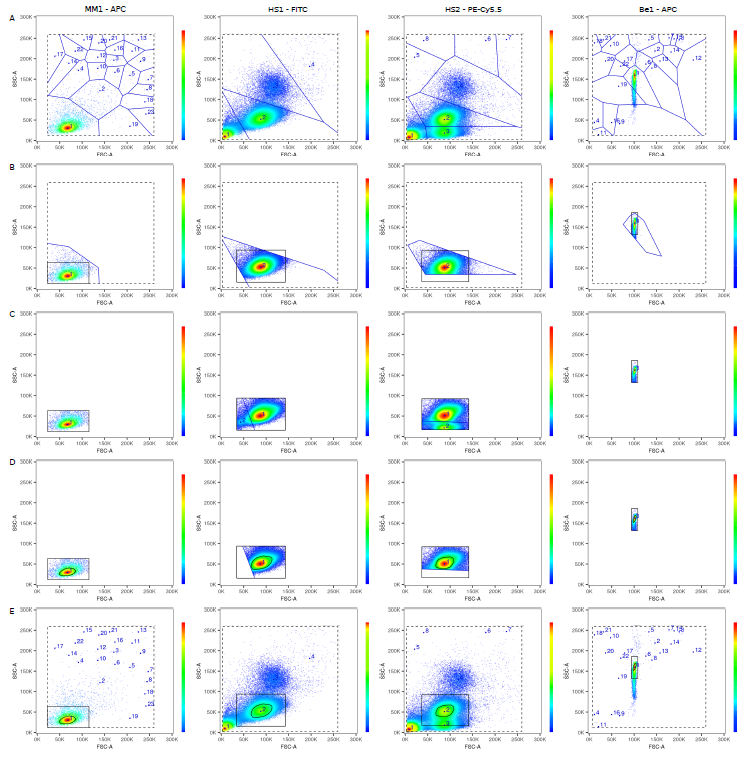
The underlying mathematics is tougher though (never thought I'd write a paper discussing "the linearity of the quantum mechanical nature of photons"!), because AutoSpill was built for actual flow cytometry users, not as a computational exercise. Carlos built the original pipeline, and then we extensively beta-tested it on 1000+ datasets over 20 months. Something as simple as a live gate becomes complex when you want it to robustly work on any dataset, cells or beads, collected on any machine. I'll spare you the details, but two stage tesselation and a 33% density estimation using a convex hull does the trick, successfully spotting the cells or beads even with heavy debris:
There are many advantages to using linear regression to calculate compensation. Why through out the data from 40,000 cells and instead turn it into two points, the way traditional compensation does? If you use linear regression you can use all of the data, which means AutoSpill works even if you have mostly negative or mostly positive data, just a shoulder of positive events or even a smear. So you can use the real antibodies on real cells to calculate your single colour compensations, rather than using beads or anti-CD4 in every channel.
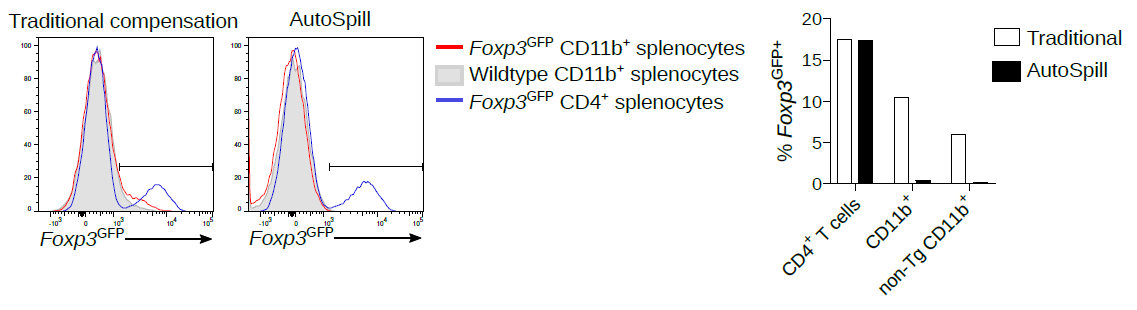
As an added advantage to this approach, AutoSpill can remove most of the autofluroscence from your flow cytometry sample. For people working on cancer or myeloid cells this can be a complete game-changer. It turns out that while cells have different amounts of autofluorescence, the spectrum of that autofluirescence is fairly constant. You can collect empty data in the worst autofluorescent channel. The single in this channel can be used to calculate the autofluorescent spectrum, which can then be calculated on a per-cell basis and used to compensate it out of every other channel.
Here are two examples:
1. Back when I was a post-doc, there were many published reports of Foxp3 expression in macrophages, epithelium, cancer, etc. All autofluorescent artefacts that wasted years of research. AutoSpill removes this autofluorescence specifically from the macrophages:
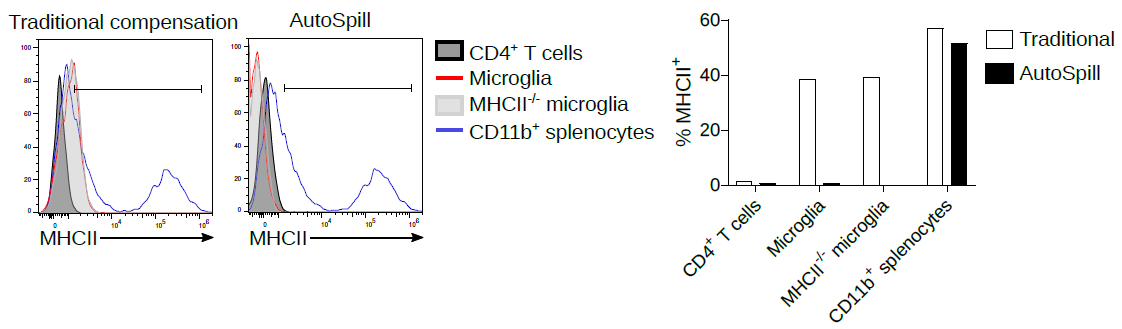
2. Now we work on microglia, and it is still argued in the literature as to whether they express low levels of MHCII at homeostasis. Using AutoSpill to remove the autofluorescent signal it is quite simple - no they don't.
Of course, AutoSpill is a tool to get an optimal solution for good data. It can't turn bad data into good data. You should always work with your Core Facility staff to optimise the machines and run high quality single colour controls.
If you like AutoSpill, and you come from a math, computer science or data science background, why not come and join the lab? We have a position open for a data science post-doc or senior scientist for another two weeks.


 Liston lab,